When a dashboard is enough, and when you need a ledger.
A counter per run, a recording rule carrying the value formula, a Grafana panel in dollars. That setup is free, private, and close to the alerting you already operate, and for plenty of teams it settles the question. The requirements change the moment the number leaves the engineering channel. This page lays out both halves.
The number stays inside engineering
Keep the dashboard. The data never leaves your network, there is no invoice, and the run-rate charts sit beside the alerts your team already watches.
The case for staying →The number has to convince someone else
A client QBR, a budget review, an auditor. That meeting asks how the figure was derived, and a dashboard has no closed months, no effective-dated rates, and no drill-down to show.
The case for graduating →One ledger, from ingest to audit.
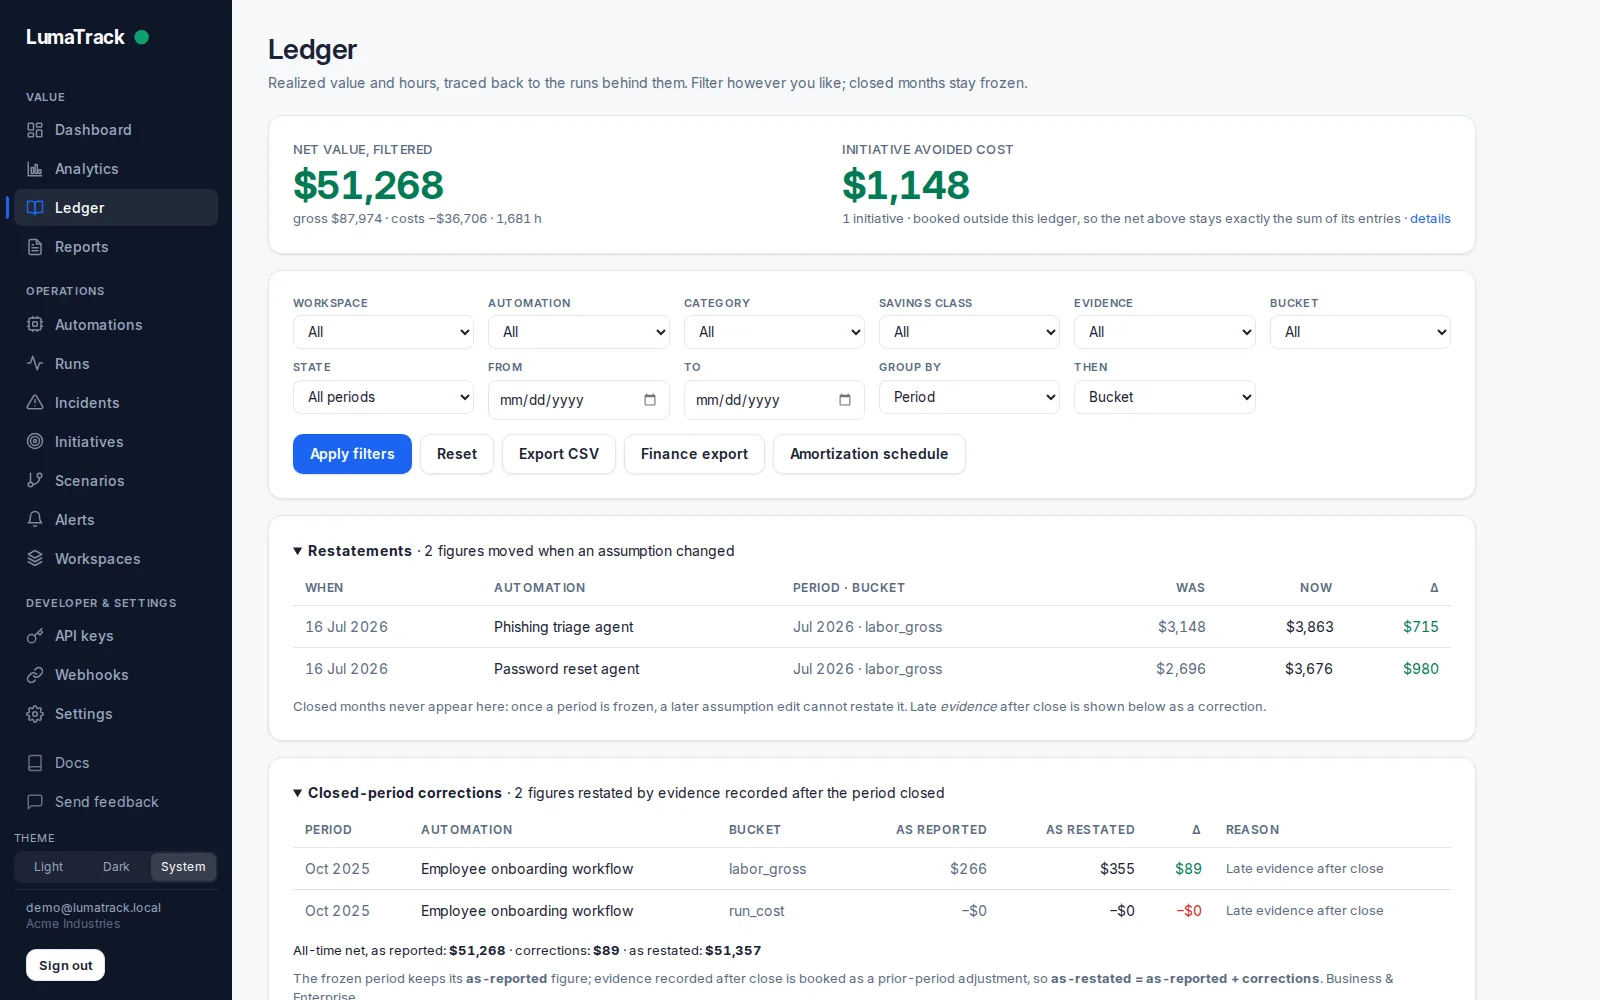
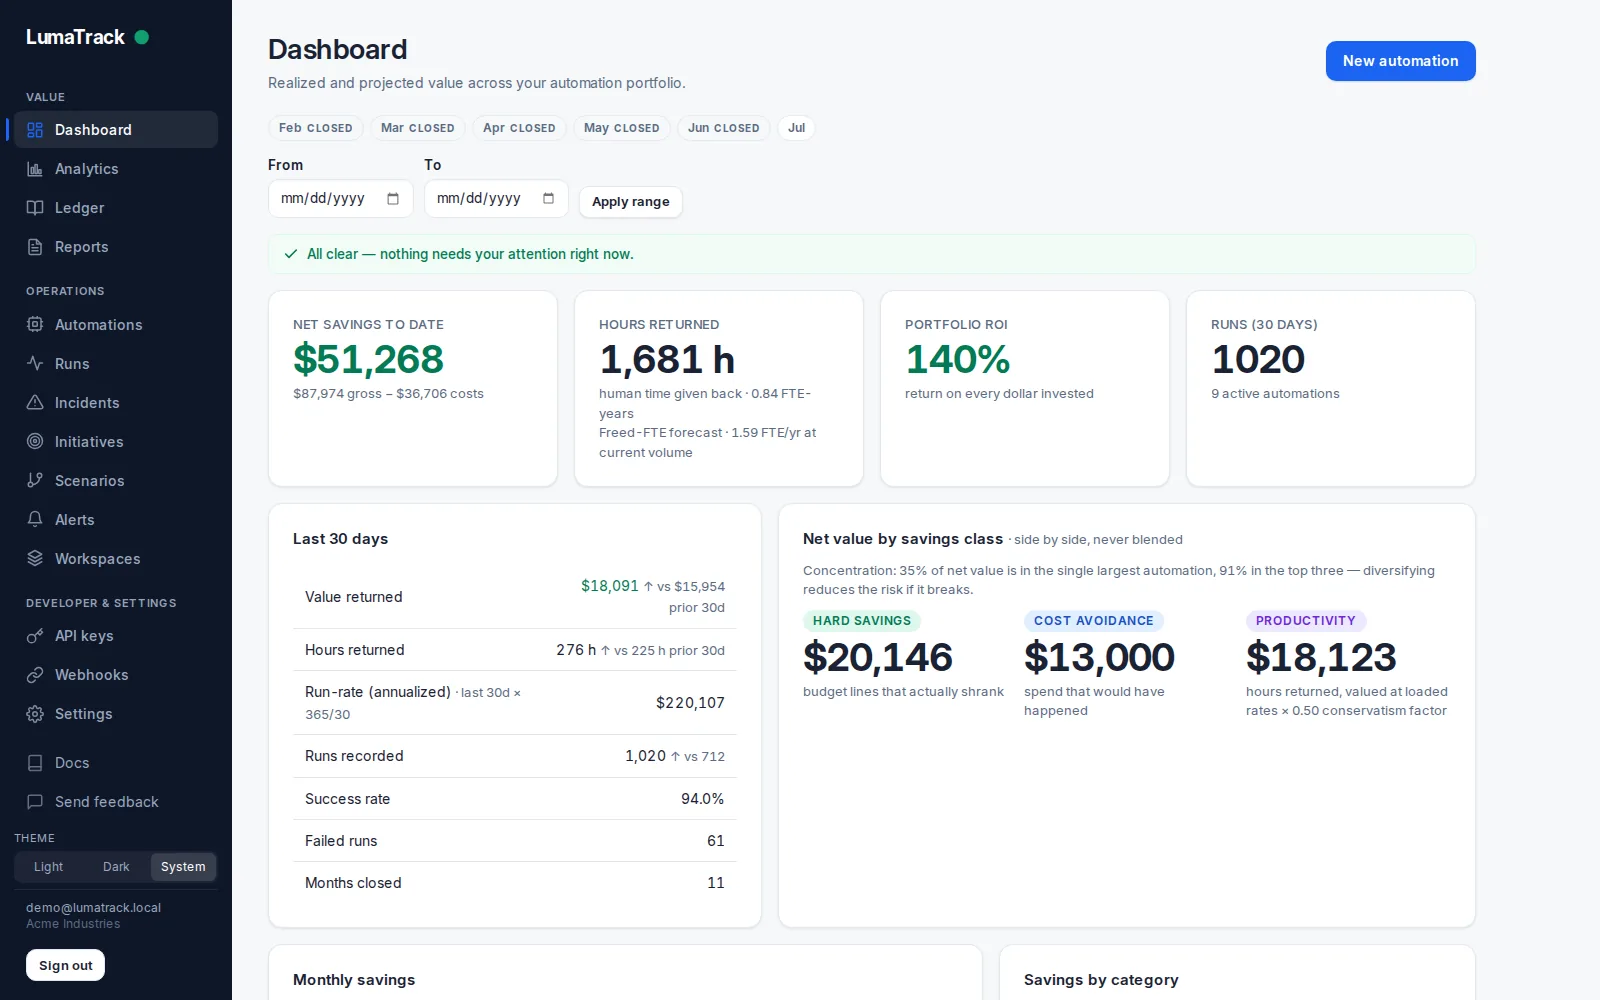
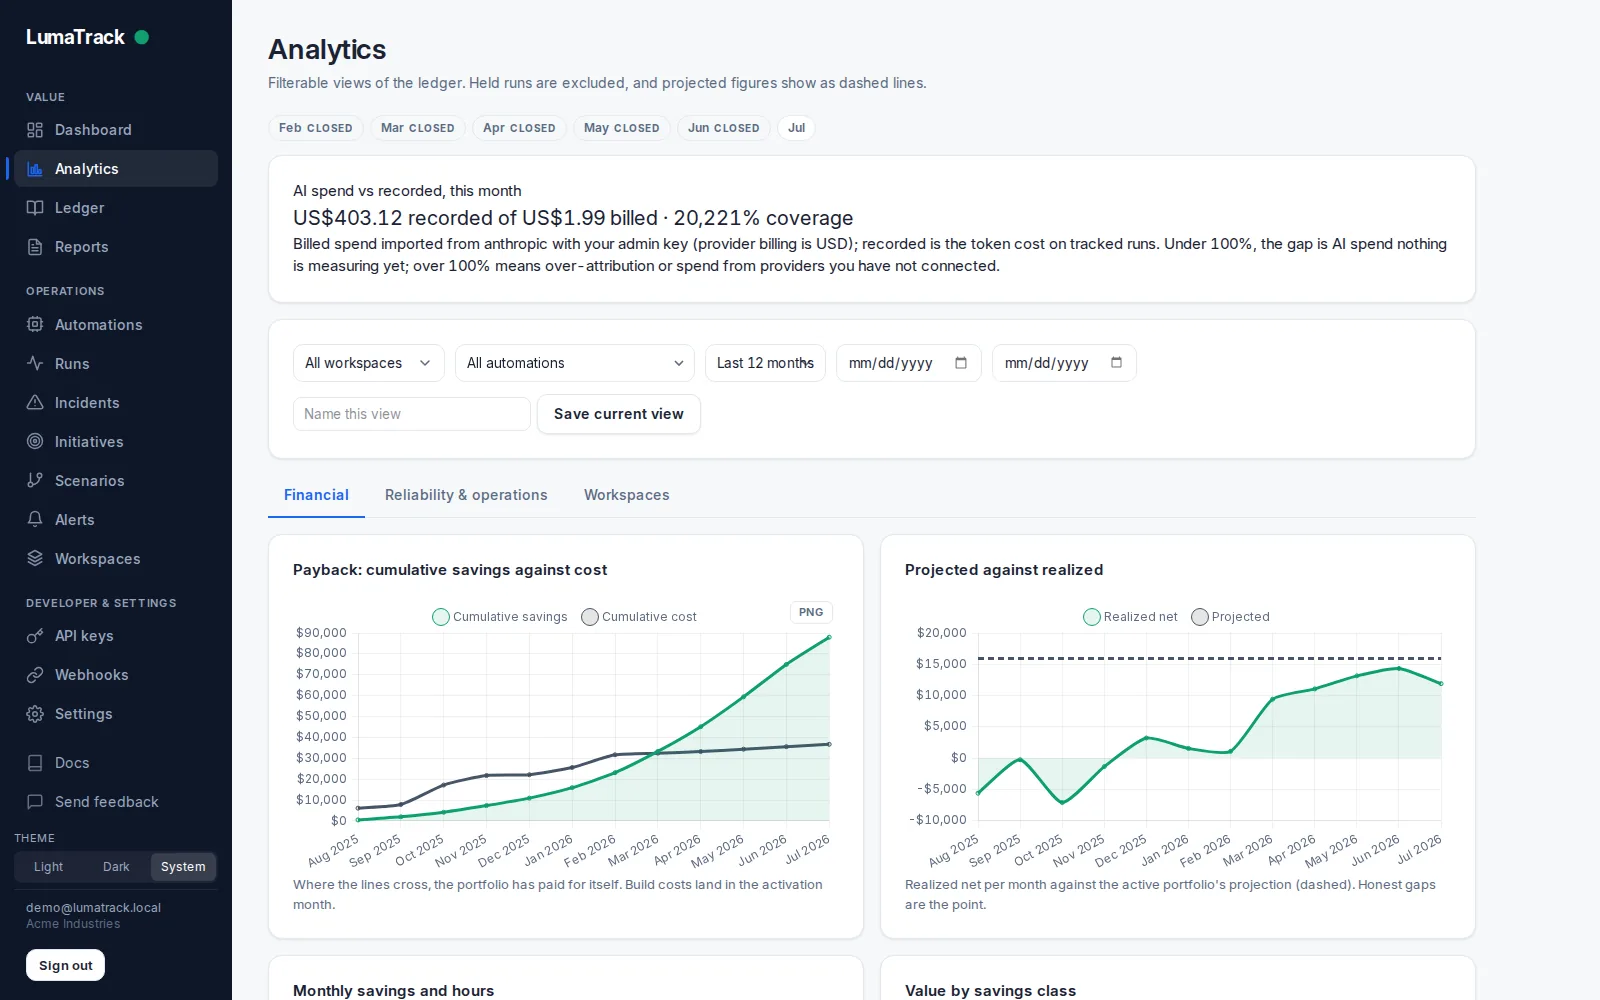
Runs come in from anything that speaks HTTP, get priced against cited rates, and become reports and exports your finance team can audit. Closed periods reconcile themselves nightly.
The screens behind the argument.
Keep the dashboard
Prometheus does real work here: the data never leaves your network, there's no invoice, and the run-rate charts sit beside the alerts your team already watches. When someone asks whether the patching playbook earns its keep, the answer is one query away. Our open-source starter kit ships that whole setup as code: a dependency-free exporter, recording rules that carry the formula, a provisioned dashboard. If the number never has to convince anyone outside engineering, that is the right amount of tooling.
The moment it stops being enough
The requirements usually change on a date you can name: a client QBR lands on the calendar, a budget review asks for last year instead of last month, or an auditor asks how a figure was derived. A dashboard falls short in that meeting in specific ways, so they're worth listing one by one.
| Dimension | Prometheus + Grafana | LumaTrack |
|---|---|---|
| A run | A count inside a counter. The individual execution is not recoverable from the aggregate. | A stored record, priced at ingest, reachable from every figure that includes it. |
| Editing a rate | Dashboards join today's rate against historical counts, so one edit silently reprices all history. | Rates are effective-dated. March stays priced at March's rates, and corrections post as their own entries. |
| History | 15 days by default; keeping more means operating remote storage yourself. | 90 days of per-run detail on Free, 13 months on Team, and value roll-ups kept forever on every plan. |
| Money | float64 samples, rounded at render time. | Decimal arithmetic to the cent, re-proved nightly against the raw runs. |
| The deliverable | A Grafana login. | A live report link or a PDF under your brand, made to hand to a client or a CFO. |
| Cost | Free, plus the hours that operating it takes. | Free for 5 automations and 25,000 run events a month. Paid tiers start at $59. |
When to stay with Prometheus
One team, one audience
The people who read the number are the people who produce it, and nothing obliges you to defend it outside the room.
Prometheus is already your day job
You operate it at scale, retention included, and a second system would be one more thing to patch.
No reporting date on the calendar
Nobody has asked for last quarter, and nobody is scheduled to.
In those cases, stay with Prometheus. The starter kit will hold, and the export below works whenever that changes.
Bring your history when you come
Export daily counts from Prometheus and replay them into the ledger with their original dates. The first report you generate will cover months from before you signed up.
Export from Prometheus
One JSON line per automation, status, and day. The script ships with the starter kit and survives counter resets.
scripts/export-history.py --days 90 > history.jsonl
Replay into the ledger
executed_at keeps each run's original date and
external_id makes retries safe, so the same run never
books twice. Imported runs carry a permanent backfilled flag: a
chart reader can always tell bulk evidence from live evidence.
The backfill guide covers CSV and
the in-app importer.
curl -X POST https://lumatrack.io/api/v1/runs/backfill \
  -H "Authorization: Bearer $LUMATRACK_KEY" \
  -H "Content-Type: application/json" \
  -d "{\"format\": \"jsonl\", \"data\": $(jq -Rs . < backfill.jsonl)}"
See your estate as a ledger.
Free tier: 5 automations, 25,000 run events a month · your data exports as CSV and JSON on every plan