For every Ansible playbook, n8n workflow, SOAR story, cron job, and AI agent you run

Know which automations pay for themselves.

Some of what you run earns its keep. Some of it quietly costs more than it saves, and the thing you have not built yet may beat both. LumaTrack prices every run from every tool at labor rates you can cite, counts the failures against the total, and tells you what to keep, what to retire, and what to build next. When someone asks you to show your work, the report is already written.
Explore the live demo, no signup →

Free tier: 5 automations, 25,000 run events/month, unlimited viewers. Forever.

Acme Industries · automation portfolio illustrative portfolio · methodology-true
Hours returned
1,608 h
productivity labeled, never blended
Portfolio ROI
313%
costs included: build, licenses, per-run
Runs (30 days)
775
6 tools, one ledger
Cumulative net value · 6 months to May 2026 · costs already netted
69%

of SOCs still assemble their metrics by hand, and nearly half call it too time-consuming.

SANS SOC Survey, 2025

36%

of CFOs are confident they can deliver enterprise AI impact. The rest are asking you for evidence.

Gartner CFO survey, August 2025

248% · 97% · 668%

the ROI your vendors claim for themselves, across commissioned studies with incompatible methodologies. Finance discounts all of them.

Forrester TEI (Microsoft) · Forrester TEI (UiPath) · IDC (Red Hat) · do your own math instead

For years I automated network changes: Ansible, Python, REST calls against switches. The playbooks worked. Every few months someone would ask what they were worth, and the best I had was a count of successful runs and a graph. That is not a number finance accepts. The failed pushes, the ones that caused an outage and cost more than doing the change by hand would have, never appeared anywhere at all. I built LumaTrack because I wanted an answer to that question.

Jonathon Davis, founder
A quick estimate

See what a single automation returns in a year.

Describe the task this automation takes off someone's plate and it works out the labor value it gives back over a year, net of what the automation costs to run.

Estimated net savings, per year
$0
0 hours returned per year
Open the full calculator →

This is a rough estimate: labor value minus running cost, before the build cost and the adoption ramp.

How it works

Three steps to a number that survives the meeting.

1

Set the baseline

What does the task cost when a human does it? Minutes times a fully loaded rate, seeded from Bureau of Labor Statistics medians and cited to the dollar. Override anything with your own numbers.

2

Stream the evidence

Anything that can speak HTTP reports each run with one call. Failures count too. A failed run costs money and saves nothing, and the ledger books it that way.

curl -X POST https://lumatrack.io/api/v1/runs \
  -H "Authorization: Bearer lmt_..." \
  -d '{"automation": "os-patching", "status": "success"}'
3

The ledger does the reporting

Net savings and hours returned, per automation and across the whole portfolio, with the payback date. It lands in your inbox or Slack on the schedule you set, ready to forward to whoever signs the budget, so the quarterly spreadsheet stops being someone's job.

What the numbers are for

Keep it, retire it, or build the next one.

One view of everything you run, ranked by what it actually returned, with the work you have not built yet ranked by what it would. Realized value is measured from your own runs. Anything forecast is labelled forecast.

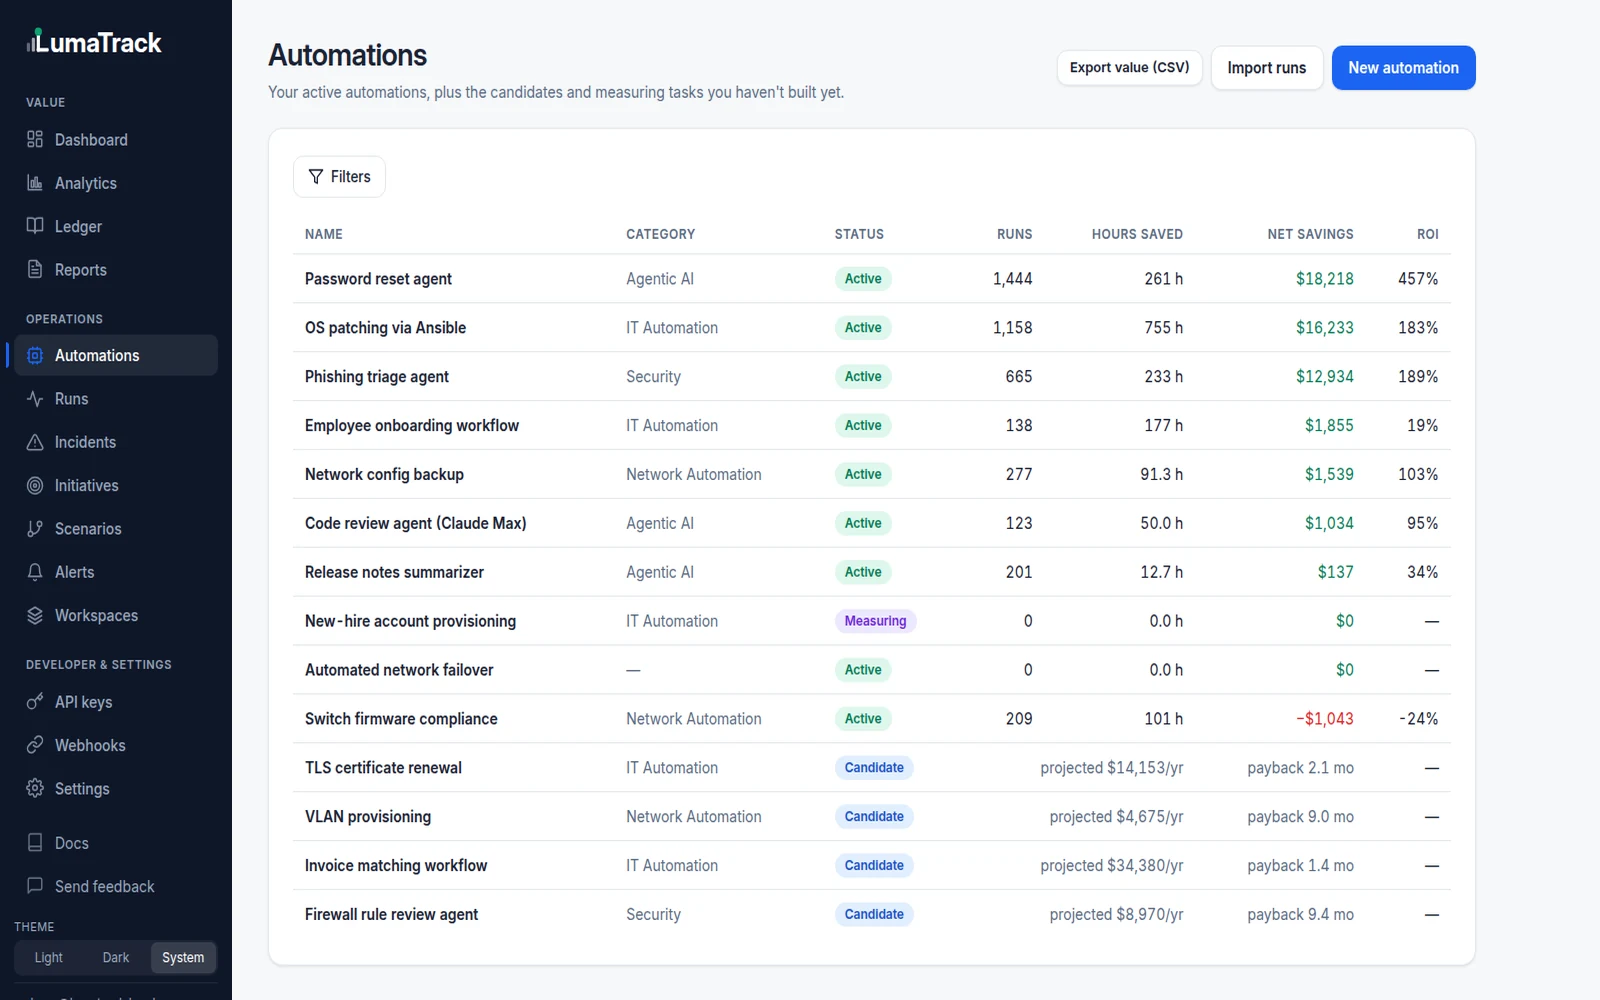
The LumaTrack automations list for Acme Industries: active automations with runs, hours saved, net savings and ROI, including one at minus $1,043 and minus 24 percent, then candidate rows showing projected annual value and payback in months.
Seven of these earn their keep. Switch firmware compliance is at −$1,043 and −24% ROI, so it is costing more than it returns and the number says so in red. The best thing Acme has not built yet, invoice matching, projects $34,380 a year with payback in 1.4 months. That is the build order the numbers argue for.

Decide what to automate next

A candidate pipeline ranks the work you have not automated yet by projected annual value and payback period, so the backlog is ranked on what each item returns and how fast.

Retire what stopped paying off

When an automation's upkeep outgrows the value it returns, LumaTrack flags it for retirement with the net-to-date in plain dollars, before it quietly costs you for another year.

Test the decision before you commit

Reprice the whole portfolio against a different rate card, or against half the volume, and see which automations survive it. The scenario runs on the same ledger, so the comparison is like for like.

The part your CFO will notice

Built like a ledger, not a dashboard.

Vendor dashboards grade their own homework: one made-up rate, failures ignored, history that rewrites itself when settings change. LumaTrack is built the way finance already works.

History that can't rewrite itself

Rates and assumptions are effective-dated; periods freeze. March's savings are priced at March's rates, forever. Every correction is its own visible entry, and a nightly job re-proves it: frozen months are checksummed against the day they closed, open figures re-derived from the raw runs, to the cent.

Savings classes, never blended

Hard savings, cost avoidance, and productivity are reported side by side, so hours returned are never counted as budget cuts. It's the distinction finance is trained to look for, made structural.

Your data leaves when you do

Every ledger row and run event downloads as CSV from inside the app, on any plan. The same records read over the API. There is no exit fee and no ticket to open. Plain CSV and JSON, still readable the day after you cancel. What you can export.

Why the call holds up

Every decision traces back to the runs behind it.

Retiring an automation is an argument with someone, so the number had better survive it. Every figure on the dashboard and in the ledger expands to the runs it came from, the rate in force when it happened, and the assumption version it was priced on. If your analyst cannot re-derive it on a calculator, we do not show it. Change an input and the correction posts as its own entry, while the closed months stay frozen.

The LumaTrack ledger: net value filtered to $51,268 with gross and costs beside it, filters for workspace, automation, savings class and bucket, a restatements table, and a closed-period corrections table.
Net value of $51,268, filtered and traceable to the runs behind it. October 2025 closed at $266 on one automation; $89 of evidence arrived afterwards and posted as its own correction, so the frozen month stays frozen and the restated all-time total reads $51,357.
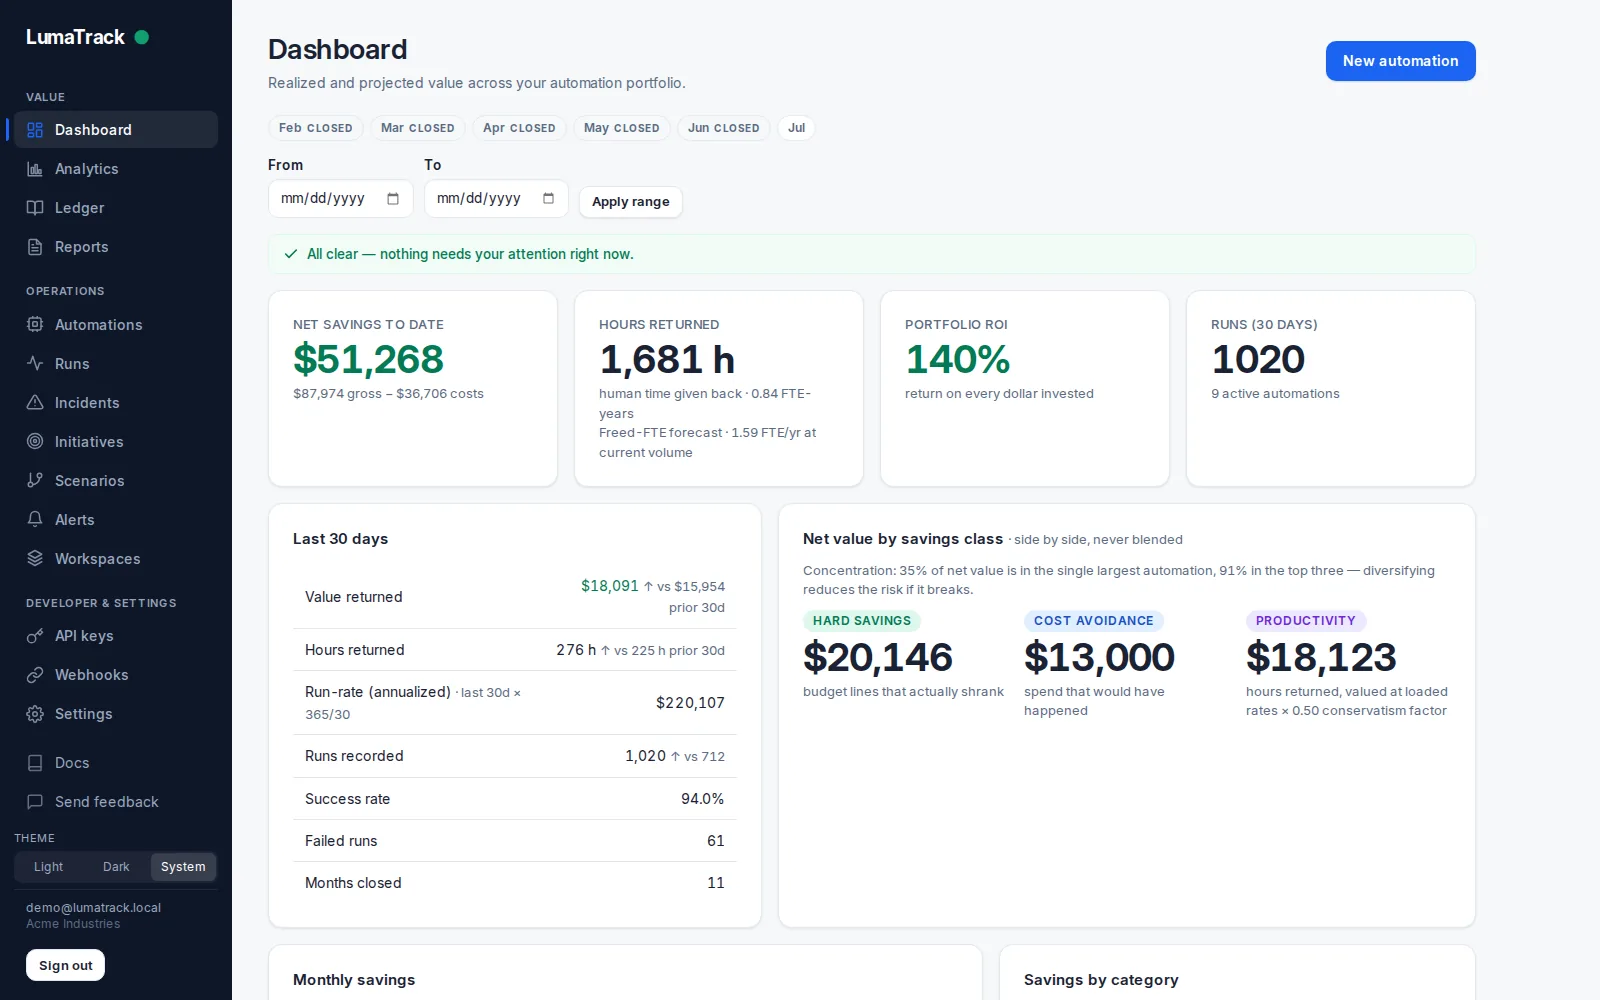
The LumaTrack dashboard: net savings, hours returned, ROI, runs, and a 30-day activity digest.
The portfolio dashboard leads with one net number, costs already subtracted.
LumaTrack analytics: cumulative payback, projected against realized, monthly savings, and reliability charts.
Projected against realized, both read from the same ledger. Where they diverge is the part most tools quietly hide.

Losses count too. Track the incidents an automation is meant to prevent, and the same ledger turns them into a board business case, then into the automation that closes them.

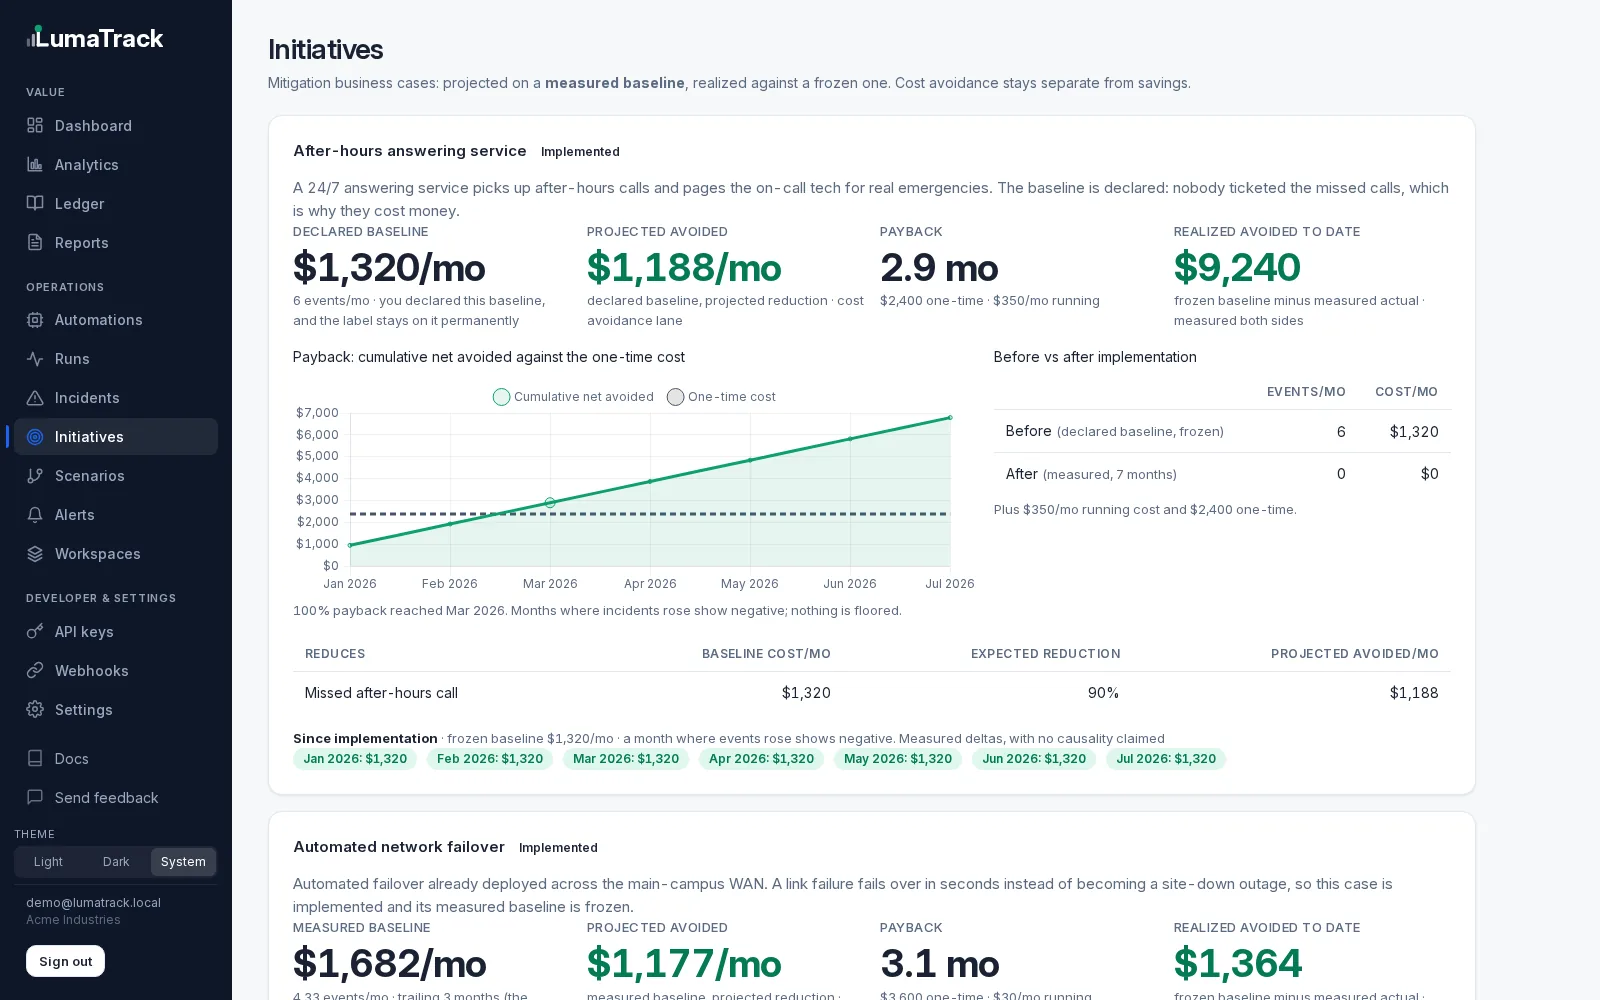
LumaTrack initiatives: an implemented 'After-hours answering service' case showing a $1,320 per month declared baseline, $1,188 per month projected avoided cost, a 2.9 month payback and $9,240 realized avoided to date, with a cumulative payback chart and a before-and-after table, and below it an implemented 'Automated network failover' rollout.
An after-hours answering service, priced from the calls that were never ticketed: $1,320 a month of baseline, $1,188 projected avoided, payback at 2.9 months, $9,240 realized so far. Turn it into an automation and the frozen baseline carries forward, so before and after stay one number and nothing is counted twice.

Reports that send themselves

A scheduled Exec Value Pack to email and Slack, and share links that stay live after you send them, so the figure the reader opens next week is the current one. Nobody assembles a deck the night before the review.

Built for the report you already owe someone

Which report are you on the hook for?

MSPs: the QBR page

"We returned $7,206 to your account this quarter, here is the math." The page that sentence comes from, generated for you.

LumaTrack for MSPs

AI teams: the agent P&L

Langfuse tells you what the agent costs. LumaTrack tells you what it's worth: runs × human baseline − tokens, on one shareable page for the perennial "is it worth it?" And when someone asks what happens if your provider reprices, the scenarios page already has the answer.

LumaTrack for AI teams

SOC: the CISO-pack section

Every Tines story and SOAR playbook reports its runs, and the automation-value section of your monthly pack assembles itself. Enrichment API costs are netted out.

Get the CISO-pack template

Network and infrastructure: the change you cannot price

Ansible playbooks, Python scripts, REST calls against switches and firewalls. Value here gets argued in avoided outages and hours of CLI work, and a failed change costs more than the manual one would have. LumaTrack prices that side: a failed run books its cost with no value against it, and downtime reduction is a value-stream type of its own.

See a network estate priced
curln8nAnsible ServiceNowTinesTorq Jira SMZendeskPowerShell GitHub ActionsOpenAI AgentsLangChain PythonC#Java Goanything with HTTP
The platform

One ledger, from ingest to audit.

Runs come in from anything that speaks HTTP, get priced against cited rates, and become reports and exports your finance team can audit. Closed periods reconcile themselves nightly.

Ingest
Run-event ingest API OpenTelemetry & LiteLLM ingest MCP server for agents Token-priced AI runs (2,400+ models) Billed AI spend import & coverage
Pricing & analysis
ROI engine, failures priced Cited BLS rate cards Savings classes & conservatism factor Flat-rate billing basis Variance, sensitivity & NPV What-if scenarios & repricing stress test Shared-cost showback Candidate pipeline
Losses & mitigation
Incident (loss) ledger Sensor & webhook incident capture Mitigation initiatives & business cases Frozen measured baselines Initiative to automation, baseline carried
Reporting & export
White-label report branding Shareable live report links Scheduled Exec Value Pack Public ROI calculator Finance export (capex/opex) BI warehouse extracts Self-serve data export, no lock-in
Governance & platform
Closed-period corrections Nightly reconciliation canary Append-only audit log Workspaces & MSP managed orgs
Run automations for clients?

The value report your QBR deck is missing.

One ingest pipe feeds every client, each one isolated with its own frozen quarters and its own evidence grades. White-label, so it goes out under your brand. Priced by your book and not your headcount.

LumaTrack for MSPs →

Some of your automations are paying for themselves.
Find out which.

Free forever tier · cancel anytime · Team $59/mo flat · Business $499/mo · full pricing.