I metered my own Claude Code usage, and the first number was wrong by exactly 2x
I build LumaTrack, which prices automation and AI runs into a dollar figure you can put in front of a finance person. So when I wired my own Claude Code sessions into it, I had a conflict of interest and I knew it. The first number it gave me said I'd saved 6.3 hours across 9 sessions.
That number was wrong. It was too high, by a factor of exactly two, and the reason it was wrong is the most common way I see people overstate what their agents are worth.
Here's the whole thing, including the bug I found in my own pricing code along the way.
The setup
Claude Code exports OpenTelemetry traces. Seven environment variables and it starts sending spans:
export CLAUDE_CODE_ENABLE_TELEMETRY=1
export CLAUDE_CODE_ENHANCED_TELEMETRY_BETA=1
export OTEL_TRACES_EXPORTER=otlp
export OTEL_EXPORTER_OTLP_TRACES_ENDPOINT="https://lumatrack.io/otel/v1/traces"
export OTEL_EXPORTER_OTLP_TRACES_HEADERS="Authorization=Bearer lmt_YOUR_KEY"
export OTEL_EXPORTER_OTLP_TRACES_PROTOCOL="http/json"
export OTEL_METRICS_EXPORTER=none OTEL_LOGS_EXPORTER=none
I found the span shape by capturing the exporter's payload on a local listener,
because guessing at someone else's telemetry schema is how you end up confidently
pricing the wrong thing. Two span kinds come out. claude_code.llm_request
carries gen_ai.system, gen_ai.request.model, and token counts. That's the one
worth pricing. claude_code.interaction carries session timing and no gen_ai.*
attributes at all, so it gets ignored.
An OTLP POST of 3 spans round-trips in 34 to 112 ms, which is well inside the range where you can leave this on and forget about it.
What nine sessions actually cost
Nine real sessions, 3 to 4 August 2026, 18 priced runs:
| Input tokens | 4,783 |
| Output tokens | 1,874 |
| Cache reads | 162,414 |
| Measured cost | $0.119264 |
Look at the cache number before anything else. 162,414 cache reads against 4,783 fresh input tokens is a ratio of about 34 to 1. Almost everything Claude Code reads, it has read before.
That ratio is the whole cost story. Anthropic prices cache reads at roughly a tenth of the base input rate, so on Opus 5 that's $0.50 per million against $5.00 per million for fresh input. The 162,414 cached tokens cost about eight cents. Nine sessions of real work came to twelve cents total.
One caveat on that total: the 18 runs span two models at different rates, since each session emits an Opus request and a Haiku sub-agent call. So the aggregate token counts above won't reconcile against any single rate card, and I'm not going to pretend they do. The per-run breakdown lives in the ledger.
The error
Now the part I got wrong.
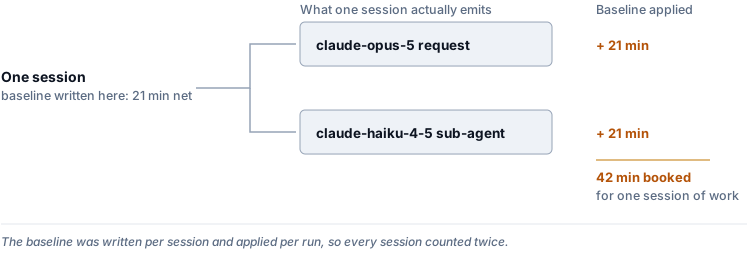
I wrote the baseline as 25 minutes of manual work with 4 minutes of oversight deducted, so 21 minutes net, which is a fair estimate of what those sessions replaced. Nine sessions at 21 minutes is 3.15 hours. The figure that came back was 6.3, and it looked great.
It was double the truth, because one Claude Code session emits two priced
runs. There's the primary opus-5 request and a haiku-4-5 sub-agent call.
My baseline was written per session and applied per run, so 21 minutes booked
against 18 runs instead of 9 sessions: 378 minutes, which is the 6.3 hours.
Corrected to 12 minutes with 2 minutes of oversight deducted per run, 10 net,
a session comes to 20 minutes.
The general shape of this bug: a per-unit baseline multiplied by a unit count that doesn't match the unit of work. It is worth ten minutes of your time to go check your own numbers for it right now, because if you're pricing agent work the odds are good you have it somewhere. If your agent makes twelve model calls per job and you wrote your baseline per job, your savings figure is inflated twelvefold.
Nothing about that error was detectable from the output. The figure was plausible, internally consistent, and confidently displayed. I only caught it because the run count didn't match the session count when I went looking for something else.
The row that said "I don't know"
The 18 runs carry three different price_version stamps: 9 from the global
LiteLLM snapshot, 8 from an override I'd added, and one that says unpriced.
That last one is my favorite thing on the screen, and it's the reason I found a second bug.
Claude Code reports its model as claude-opus-5[1m], with the context window as a
bracketed suffix. No upstream LiteLLM key carries a bracket suffix. I checked all
2,986 of them. So the lookup missed, and there was no price for that model id.
What the system did next is the part that matters. It booked the run unpriced and flagged it, rather than quietly pricing it at zero. That distinction is the difference between a tool that tells you what it doesn't know and one that hands you a savings figure that's too good and impossible to falsify. A silent zero would have shown a slightly cheaper run and no indication anything was wrong.
The flag is what sent me looking, and the fix shipped two days later: resolution
now tries the literal model id first and the bracket-stripped id second, so
claude-opus-5[1m] finds claude-opus-5. An explicit long-context price still
wins if one exists, and so does a per-org override, so nobody's existing numbers
moved underneath them.
There's a small joke buried in it. claude-opus-5 already has a 1M context window
as its default and its maximum, with no separate premium tier for long context. The
[1m] suffix names a window that isn't separately priced, which is exactly why no
price table carries it.
The unpriced row is still sitting in my ledger, because cost is computed at
ingest and I don't rewrite history. It's a fossil of a bug, and I'd rather keep it
than have a clean screen.
What this doesn't tell you
Some honest limits, because a post about measurement that hides its own error bars isn't worth much:
- Nine sessions on one developer's machine. A sample, not a study. Your cache ratio in particular will differ with your working style.
- The cost is measured. The time saved is my assumption. Token counts come from the API. The "12 minutes of manual work" is a number I chose, and any tool that presents those two with equal confidence is misleading you. Mine labels estimates as estimates for exactly this reason.
- The Python OTLP exporter can't do this directly. It speaks gRPC and
http/protobuf only, so a Python stack needs an OpenTelemetry Collector with an
otlphttpexporter in front. Claude Code and Node speakhttp/jsonnatively. - Cost is computed at ingest and never recomputed. Runs ingested before a price existed stay unpriced, which is why that fossil row survives.
If you want your own number
The env block above is the whole setup. Point it at a free workspace and your next Claude Code session shows up priced, with every figure opening to the runs underneath it.
Whatever you use to measure this, check your unit of work first. The tooling will happily multiply the wrong baseline by the wrong count and give you a number that looks like a win.